Friday, July 7, 2017

KLSE 52 Weeks Low Stocks

52 weeks low stocks are stocks which hit new low or on low of 260 trading days (52 weeks) period. Warrants are excluded from this scan (However, as this scan runs and update automatically, due to data issue, some warrants could be included). 52 weeks low scan result updated on 1/06/2018.

Stock NamePrice
AMTEL0.610
AMVERTON0.910
ARK0.285
ASIAPLY0.085
ASTINO0.760
AT0.065
BLDPLNT8.010
CENSOF0.165
CHEETAH0.380
CHINHIN0.750
CIHLDG1.850
CLIQ0.720
CME0.035
COASTAL1.080
CSL0.010
CVIEW1.360
DIGISTA0.085
DRBHCOMC500.020
DRBHCOMC550.030
EITA1.310
EKSONS0.680
EMETALL0.460
EMICO0.185
FCW0.830
FINTEC0.075
GENTINGC460.010
GENTINGC470.025
GENTINGC490.005
HHGROUP0.185
HLCAP9.790
ICON0.095
IDMENSN0.040
IHS04600082497.500
JADI0.045
JAYCORP0.850
KAREX0.540
KGROUP0.060
KIMHIN1.280
KIMLUN1.460
KINSTEL0.005
KNM0.180
LAFMSIA2.950
LBICAP0.830
LEBTECH1.070
LKL0.140
LNGRES0.135
MALAKOFC100.045
MAYBANKC390.085
MCLEAN0.120
MENTIGA0.510
MGB0.940
MITRA0.465
MPCORP0.060
MSPORTS0.035
MTDACPI0.170
MUDAJYA0.500
NAIM0.610
NETX0.025
OKA1.130
PASUKGB0.115
PELIKAN0.615
PERDANA0.185
PESONA0.265
PETONE0.055
PHB0.025
PPG0.435
PTARAS2.900
REDIDEA0.350
RSAWIT0.290
SAPNRGC500.005
SAPNRGC520.005
SAPNRGC530.005
SAPNRGC540.005
SAPNRGC550.005
SAPNRGC560.005
SAPNRGC570.005
SAPNRGC650.085
SCBUILD0.025
SCOMIES0.070
SEDANIA0.185
SHH0.740
SHL2.460
SKBSHUT0.500
SOLUTN0.140
SONA0.475
SSEB304.567
SYMLIFE0.600
TAFI0.300
TANCO0.095
TASEK7.020
TECGUAN0.910
TGL0.880
TIENWAH1.350
TNLOGIS0.970
TRC0.430
TRIVE0.025
TURIYA0.150
ULICORP1.470
YFG0.005

Thursday, July 6, 2017

KLSE Uptrend Stock List

Uptrend scanner scans stocks which are in long, medium and short term uptrend with decent trading volume.

Uptrend Scan result updated on 1/06/2018.

Stock NamePrice
BPLANT1.300
HIBISCS0.900
KPSCB0.650
LEESK0.890
OPCOM0.805
SCIB0.710
SENDAI0.925

Sunday, July 2, 2017

How to find Uptrend Stocks in KLSE?

Trend following is one of the simplest way to make money in stock market. You identify shares which are in good trend, buy and follow it until the trend change and exit the position. The assumption is: if a share is in good trend now and in the past, it is possible that the trend will continue in future. The entry point is usually not very important and the holding period is from medium to long term. Therefore, trend trading is suitable for beginner and part-time traders.

The winning rate usually is not high but if you manage to catch some of the shares which the trends extended for long time,  the profit will be more than enough to cover your loss in other trades. 

Let's implement a Amibroker trend scanner in this post, yes it should be up-trend to be exact because we can only trade long in KLSE. 

The code is as below:

uptrend = C > EMA(C, 30) AND EMA(C, 30) > MA(C, 50) AND MA(C, 50) > MA(C, 200);
decentVolume = (MA(V, 20) * C) > 3500;
priceRange = C >= 0.5 AND C <= 1.5;
Filter = uptrend AND decentVolume AND priceRange;   

The scanner consists of only 4 lines of code. As I explained in other post before, C represents close price and V represents volume in Amibroker. First line of code filters the stocks which are in short, medium and long term up trend. We do this by mainly using moving average with different periods. The code should be self explanatory. Of cause moving average is only one of the simplest way to identify trends, you can using any other indicator or technique which is suitable. 

Second line of code is just an extra filter to make sure the shares we filtered are trading with good volume so that they are liquid enough to trade. Third line of code filters the price range of the share, in this example, we are only interested in share between RM 0.5 to RM 1.5.   

Last line of code combines all of the conditions together and assigns it to Filter variable which will be used by Amibroker exploration feature to filter the stocks. 

Friday, June 30, 2017

Develop a 52 Weeks Low Scanner

Last week, someone in a stock forum posted a comment requested for stocks in KLSE which break 52 weeks low. This is indeed a very popular rule, you might be able to get the list from newspaper or some other website. In this post, let's try to develop this scanner, it is only one line of code! Why not we create it ourselves?

The code is as below:

Filter = C < Ref(LLV(L, 260), -1);


That's it. C is close price, L is is low price. The function LLV is to find out lowest value of the bars in the period. The second parameter is period which is 260 days here. 260 days is number of working days in a years (deduct weekend). To make it simple we will not consider other market close days like public holiday. The value return from LLV(L, 260) is the lowest price in last 260 days (bars). Function Ref refers to previous one day of value of LLV(L, 260). If we read this line of code in plain English, it is - Get me list of stock where close price is lower than the lowest price in the previous period of 260 days from yesterday. This is exactly what we want - today price breaks the new low of previous 260 days.

In Amibroker, we will use "Explore" feature in analysis to run this code as custom formula, we will get 52 weeks low stocks list in just a few seconds.

The following is the screenshot of our 52 weeks low scanner Amibroker "Explore" result.


Note that, Amibroker also provide time frame related functions to compress daily bar to weekly bar so we can operate on weekly bars. I will let you guys to explore these functions if you are interested, you can post me a comment if you face any issue.  

You can follow result of the 52 Weeks Low Scanner. I will update this result at least once per week.       
  

Wednesday, June 21, 2017

Develop and Back Test a Breakout Strategy

It has a been a while I haven't updated this blog, I was busy working on my trading algorithm and I started running one of my trading strategy live for few months now! Best of all, I managed to create a trading management platform which help me to manage my order including submission of buy/sell order. That means, my trading system is fully automated and it can run unattended without any human intervention. It could be the first fully automated trading system running by retail investor in KLSE! Sound interesting? Stay tuned, I might show you how it works in next posts.    

Nonetheless, I am still working hard on R&D of more new trading strategies. I would like to have at least 2 trading strategies running live concurrently to diversify

Recently I received a set of trading rules from a friend. I have created Amibroker program from the rules. In this post, I will show you guys how to convert this rules to code and back test it. As I am a strong believer of data and statistic, whether these rules work or not, I will let back test result speaks for itself.

The trading rules go as following: 

1. Price breakout from side way with huge volume
2. Golden cross before the price break out - Short MA crosses above long MA
3. Wait for pullback with small volume after the breakout
4. After pullback enter at next day open if current close price is greater than previous day high
5. Set the cut loss point to previous day low
6. Sell at next day open if any of the condition met
   - price hit cut loss point
   - death cross - short MA cross below short MA 
   - price drop with huge volume  
   - price open high close low with high volume
   - price hits trailing stop
7. Note that the rule only applicable for stock with price from 0.2 to 1.5

At a glance, these are quite common and typical rules for a breakout or momentum strategy, I did apply some of the rules in some of my previous trading strategies and they work very well. But will all these rule work as a complete trading system or strategy? Let's find out.

Let's examine the rule one by one and I will show you how do I quantify it and convert it to Amibroker code.

Rule 1. Price breakout from side way with huge volume

Code explanation: 
//sideway
sideway = Sum(RSI(14) > 65 OR RSI(14) < 35, 40) < 5 AND ROC(C, 40) < 15 AND ROC(C, 40) > -15;   

Explanation: The line of code expresses price moving in side way for last 40 days. It seems a bit complex, but the idea of side way is price should not fluctuate too much and the different of today price with previous 40th days must be small, in the code it is within -15% and 15%. I uses RSI to indicate price should not fluctuate too much, RSI value should be mostly within 35 and 65 in 40 days period. The rules doesn't say how long is the period of side way, but here I have hard coded to 40 days. We could optimize this value in back testing later.   

//breakout
breakout = C > Ref(HHV(H, 40), -1);

Explanation: The line of code above verifies the closing price today is greater than the highest price of previous 40 days. In another words, the price has breakout from 40 days highest price. Again we can leave 40 days as a parameter to optimize.  

//decent volume
decentVolume = MA(V, 3) > MA(V, 18); 

Explanation: 3 period moving average of volume of the stock is greater than 18 period of moving average of volume. It means the recent volume is relatively big. 

Rule 2. Golden cross before the price break out - Short MA crosses above long MA 
//short MAA stay above Long MA
shortMAAboveLongMA = MA(C, 20) >= MA(C, 60);

Explanation: I simplify the rule by short MA must stay above long MA.  

Rule 3. Wait for pullback with small volume after the breakout

//monitor signal
tradeFilter = volumeFilter AND priceFilter;

monitorSignal = breakout AND decentVolume AND shortMAAboveLongMA AND Ref(sideway, -3) AND tradeFilter;

//Average volume around breakout period 
averageBreakoutPeriodVolume = ValueWhen(monitorSignal, MA(V, 5));

//price drop with small volume
priceDropWithSmallVolume = C < Ref(C, -1) AND V <= averageBreakoutPeriodVolume;

fisrtAdjustAction  = priceDropWithSmallVolume AND Ref(allUpSinceSignal, -1); 

//adjust

allAdjustSinceFirstAdjust = priceDropWithSmallVolume AND BarsSince(fisrtAdjustAction) == Sum(priceDropWithSmallVolume, BarsSince(fisrtAdjustAction)) AND BarsSince(fisrtAdjustAction) <= 5;

Explanation: The codes above are not easy to understand especially for beginner. The first 2 lines however are not related to pullback, it just combines all of the conditions above so that we can pass the variable to our code about pullback. The third line is to get the average volume when the price breakout from side way. The second line is to define the pullback action where the price should drop and volume should be smaller than average volume when breakout. The last 2 lines express one or more than one pullback action on each bar until the current bar. For example, if price pullbacks from Monday to Wednesday, then stock price must drop everyday with small volume (compare to breakout volume) for every single days in this period.   

Rule 4. After pullback enter at next day open if current close price is greater than previous day high

//entry bar
entrySignal = C > Ref(H, -1) AND Ref(allAdjustSinceFirstAdjust, -1);

//Buy Signal

Buy = entrySignal;

Explanation: This is our actual entry signal. It compares today close price with previous high price, if close price is higher than yesterday highest price, it is an indication that pullback is over and stock price is reversed. We set the entry signal as our buy signal. Based on backtest setting, we will buy this stock at next day open price. 

  
So far we have completed our Buy rules. Let;s continue working on Sell rules below.


Rules 5. Set the cut loss point to previous day low


//cut loss level 
cutLossPoint = ValueWhen(entrySignal, Ref(L, -1));

Explanation: This is a simple formula, we just get the lowest price of the bar when entry signal is triggered and set it as our cut loss point.

Rule 6. Sell at next day open if any of the condition met

   - price hit cut loss point
   - death cross - short MA cross below short MA 
   - price drop with huge volume  
   - price open high close low with high volume
  
   
  //Death cross
deathCross = Cross(MA(C, 60), MA(C, 20));

//bad Volume 
badVolume = V > MA(V, 5) * 2 OR V > averageBreakoutPeriodVolume;

//Drop with bad volume 
badDrop = C < Ref(C, -1) AND C < O AND badVolume; 

//Open Up Close Low with bad volume
openUpCloseLow = O > Ref(C, -1) AND C < O AND (C-L)/(H-L) < 0.5 AND badVolume; 

Sell =  C < cutLossPoint OR deathCross OR badDrop OR openUpCloseLow;

Explanation: The code above should be self explanatory. The badVolume variable refers to high volume when share price drop. I define it as volume of the bar greater than 2 times of 5 days moving average of volume or the volume is greater than the average volume when breakout. So if share price drop or share price open high and close low with with "bad" volume it will meet our sell condition. Similarly, we will sell the stock at next day market open.


Rule 7. Note that the rule only applicable for stock with price from 0.2 to 1.5 & volume filter

//price filter

priceFilter = C > 0.2 AND C < 1.5;

//decent volume to trade

volumeFilter = (MA(V, 20) * C) > 3500;

//monitor signal

tradeFilter = volumeFilter AND priceFilter;

Explanation: Again, a self explanatory code, we only buy stock which close price is between 0.2 to 1.5. We also have to make sure the volume of stock is liquid enough for us to trade. We simply check it by price volume value of the stock is greater than 3500 (or RM 350000 since in KLSE the volume is in lot - 100 shares). If you notice the code in Rule 3 above, the condition is applied by Anded with other rules. 

That's all about the important part of my code for the breakout strategy, I have omitted some other codes like position sizing. I set the position size to maximum 5 positions with equal 20% of capital each. 

Back test  Result

Let jump to the back test result and examine a few of our sample trades. 


The back test period is from 1-1-2001 to 31-12-2016 which cover 16 years of historical data for all stocks listed on KLSE. First image is statistic of backtest. It shows the performance summary with 7.89% annual return and 20.28% average draw down. The second image is equity curve and draw down chart.   


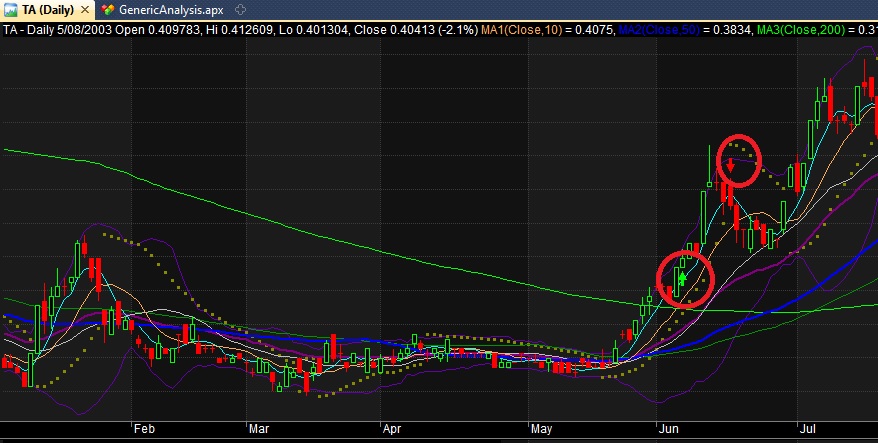
The chart above shows a typical winning trade, green and red arrows are entry and exit respectively. You can refer to the rules explained above to learn how the signal are generated.  


The chart above shows a typical lossing trade.


In conclusion, this post focuses on converting the rules of a strategy to code, back test and verify whether it meet our expectation. I will not touch on how to optimize the rule and to improve a strategy here. I always advise traders to backtest a strategy and verify any trading idea/rule before following it. Some of the rules seems to be working or it could be given by some successful sifu which looks convincing, but the result from backtesting could reveal another story. Back testing definitely will help to eliminate or reduce the risk in this respect.    

Thursday, May 21, 2015

KLSE Share Trading Signal - Volume Spike Strategy

The following are the trade signals generated from Volume Spike Strategy SystemThe date above each table is the date of trading day to trade the signals. 

Entry Rules - Buy Signal
  • Check the stock price within 30 minutes before market close, buy at market price if price is up from previous day close (green) and only up for less than 10%. Don't buy if the conditions are not met. 
Exit Rules - Sell Signal
  • Sell when market open at market price

03/08/2015

CounterClose PriceTrade SignalSpike Volume200 Days Average VolumeRSI(9)


Disclaimers: The signals are provided for educational purpose only. Trade at your own risk. KLSE System Trader will not responsible for any financial loss trading the signals above.    

Saturday, May 2, 2015

Performance result of a share trading system

In my previous post, I have explained about back testing process. But how do we determine whether performance result of a back testing is good? Is annual return the only statistic which we should consider? Apparently, the answer is no.

The following are the summary of statistics which we should consider:

  • Annual return - No doubt that annual return is a most well known statistic which most of the traders will look at. Generally, 20-40% is a decent return for a trading system.     
  • Average bars held - Average number of days a stock is held. It depends on your strategy whether it is a short, medium or long term strategy. Average bars held could be range from 1-5 (days) for short term trading strategy, few days to few months for mid term strategy and few weeks to months or years for long term strategy.    
  • Winning rate - Wining rate is how many percent of the trades are profitable out of total trades. High winning rate is important but we also need to consider average profit for a winning trade. For example, the winning rate for system A is 60% but the average profit for a winning trade is only 1%. This system is not better than system B which has 40% winning rate and 10% average profit for a winning trade.   
  • Maximum consecutive win -  The largest number of consecutive win trades. The higher is the  better. But we have to compare this statistic with maximum consecutive lose. Ideally maximum consecutive win should be greater than maximum consecutive loss. However it depends on our strategy, for example trend following strategy with lower winning rate tend to have higher maximum consecutive loss.
  • Maximum consecutive lose -  The largest number of consecutive lose trades. Ideally, this number should not be too high. High maximum consecutive lose will affect our confident on a trading system. If our system are having more than 15 consecutive loss trades in live trading, most likely we will lost confident and eventually abandon the system.
  • Maximum trade drawdown - In simple words, maximum trade drawndown refer the loss of worst performing trade in the back testing.  
  • Maximum system drawdown - System drawdown refers to percentage of equity dropping from its high. For instance, a back testing cover 10 years period from 2001 to 2010. The starting capital is $100,000, in May, 2005 the total equity is $500,000. But due to bear market, there were high number of consecutive lose trades and in August 2005, the equity was dropping to $400,000 before rising again. The drawdown can be calculated as  (500000-400000)/500000 * 100 = 20%.    
  • CAR/MaxDD - The value is derived from dividing annual return by maximum system drawdown. This is one the of most the important statistic to determine the performance of a trading system. CAR/MaxDD should be 1 or greater than 1.   

The following are the statistics from back testing of volume spike strategy, the statistics explained above are highlighted in RED


Statistics
All trades Long trades Short trades
Initial capital 100000.00 100000.00 100000.00
Ending capital 5175603.43 5175603.43 100000.00
Net Profit 5075603.43 5075603.43 0.00
Net Profit % 5075.60 % 5075.60 % 0.00 %
Exposure % 55.51 % 55.51 % 0.00 %
Net Risk Adjusted Return % 9143.22 % 9143.22 % N/A
Annual Return % 30.09 % 30.09 % 0.00 %
Risk Adjusted Return % 54.20 % 54.20 % N/A
Total transaction costs 411330.66 411330.66 0.00

All trades 807 807 (100.00 %) 0 (0.00 %)
 Avg. Profit/Loss 6289.47 6289.47 N/A
 Avg. Profit/Loss % 5.80 % 5.80 % N/A
 Avg. Bars Held 26.14 26.14 N/A

Winners 316 (39.16 %) 316 (39.16 %) 0 (0.00 %)
 Total Profit 8290827.88 8290827.88 0.00
 Avg. Profit 26236.80 26236.80 N/A
 Avg. Profit % 24.80 % 24.80 % N/A
 Avg. Bars Held 42.64 42.64 N/A
 Max. Consecutive 10 10 0
 Largest win 1131384.57 1131384.57 0.00
 # bars in largest win 197 197 0

Losers 491 (60.84 %) 491 (60.84 %) 0 (0.00 %)
 Total Loss -3215224.46 -3215224.46 0.00
 Avg. Loss -6548.32 -6548.32 N/A
 Avg. Loss % -6.42 % -6.42 % N/A
 Avg. Bars Held 15.53 15.53 N/A
 Max. Consecutive 12 12 0
 Largest loss -80543.62 -80543.62 0.00
 # bars in largest loss 34 34 0

Max. trade drawdown -555393.67 -555393.67 0.00
Max. trade % drawdown -31.30 % -31.30 % 0.00 %
Max. system drawdown -629463.10 -629463.10 0.00
Max. system % drawdown -20.45 % -20.45 % 0.00 %
Recovery Factor 8.06 8.06 N/A
CAR/MaxDD 1.47 1.47 N/A
RAR/MaxDD 2.65 2.65 N/A
Profit Factor 2.58 2.58 N/A
Payoff Ratio 4.01 4.01 N/A
Standard Error 726223.99 726223.99 0.00
Risk-Reward Ratio 0.26 0.26 N/A
Ulcer Index 10.50 10.50 0.00
Ulcer Performance Index 2.35 2.35 N/A
Sharpe Ratio of trades 0.47 0.47 0.00
K-Ratio 0.0181 0.0181 N/A